Data Anomaly Detection
Freshness
Section titled “Freshness”The automated freshness monitoring system tracks the frequency of updates on a table and notifies when the latest update becomes outdated by creating an incident in the Masthead UI and sending an alert to the Slack channel.
Masthead analyzes one month’s worth of retrospective logs to inform its ML model, ensuring that Masthead applies the freshness metric to all time series tables within 5-6 hours of deployment.
Masthead detects freshness anomalies in real-time. As Masthead examines log patterns, any deviation from the expected data ingestion schedule triggers an alert about the anomaly.
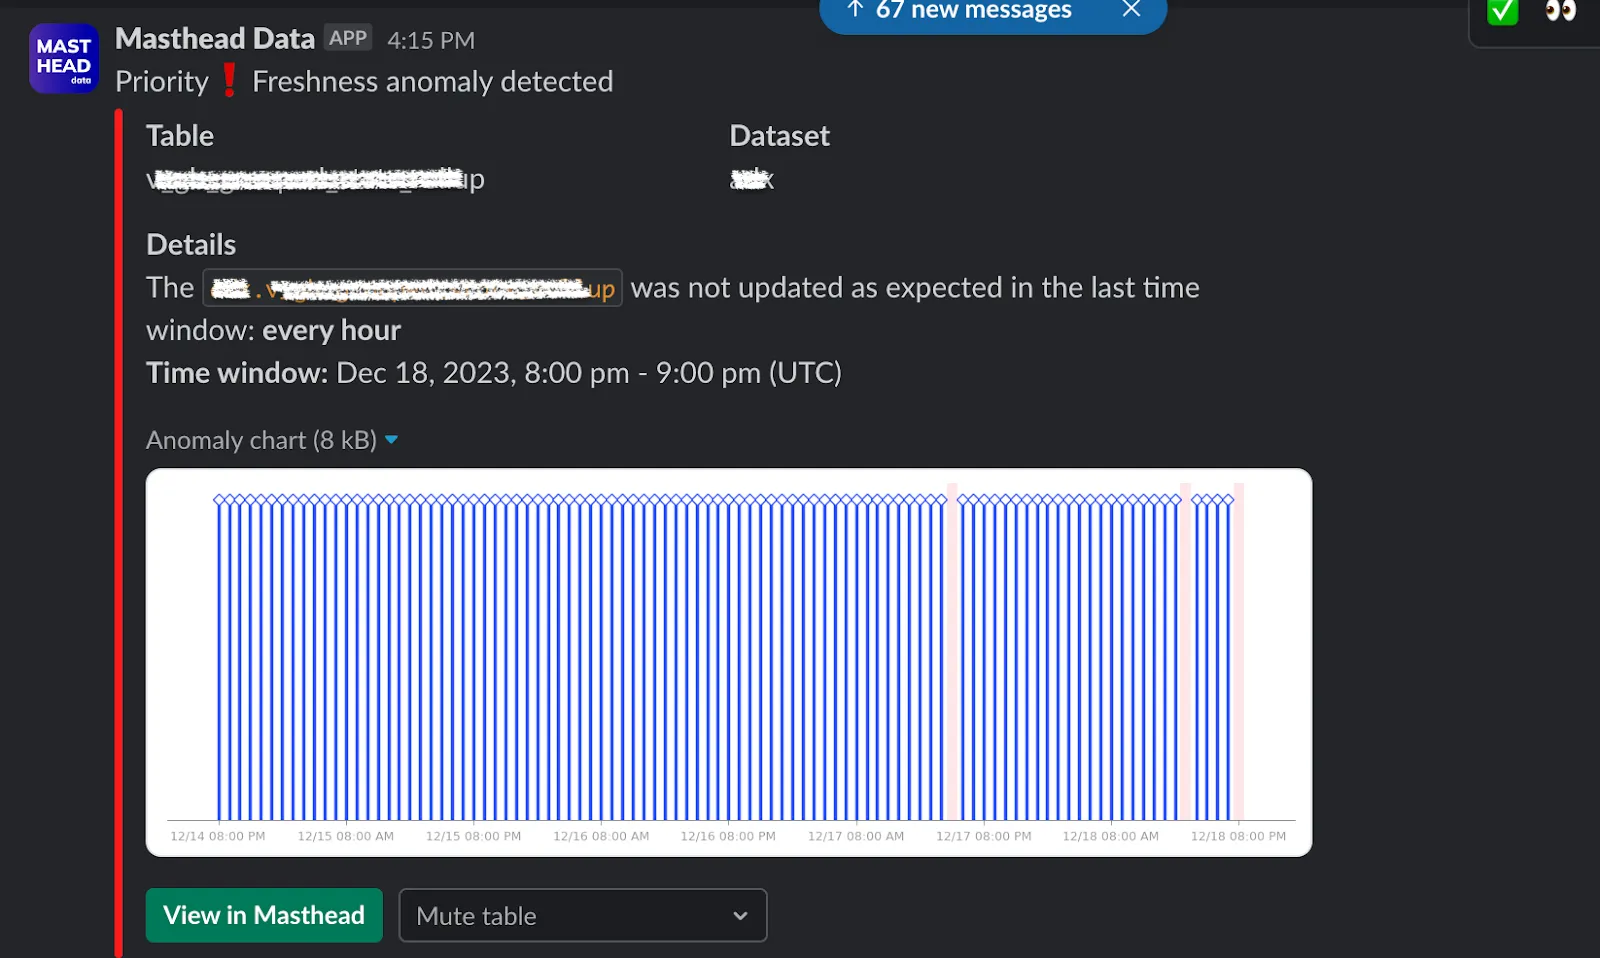
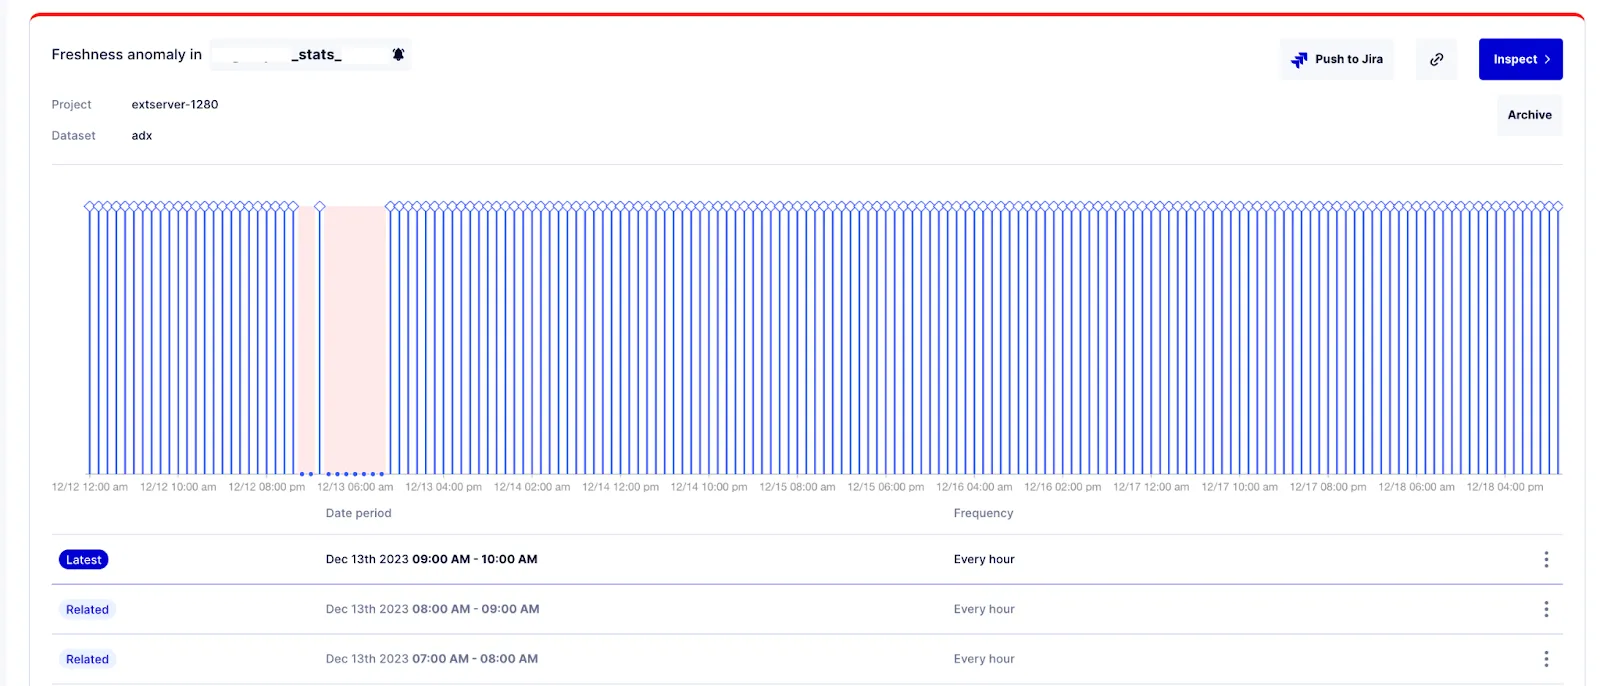
The Incident tab contains:
- The name of the table where the incident occurred.
- Location on the table: its project and dataset.
- A graph indicating when the table failed to update, marked in red. Each blue bar represents an update event for the table.
- Below each incident, there is a display showing the duration of the missed updates and the expected update frequency based on past patterns.
Volume
Section titled “Volume”The automated volume anomaly detection system examines variations in the number of rows changed in a table and provides real-time alerts for unexpected data volume changes. This includes significant additions or deletions of data or any unusual patterns in row changes.
Masthead analyzes one month’s worth of retrospective logs to inform its ML model, ensuring that Masthead applies the freshness metric to all time series tables within 5-6 hours of deployment.
Masthead detects volume anomalies in real-time. When Masthead analyzes log patterns, any deviation from the expected data range during ingestion triggers an anomaly alert, both in the Masthead interface and on Slack.
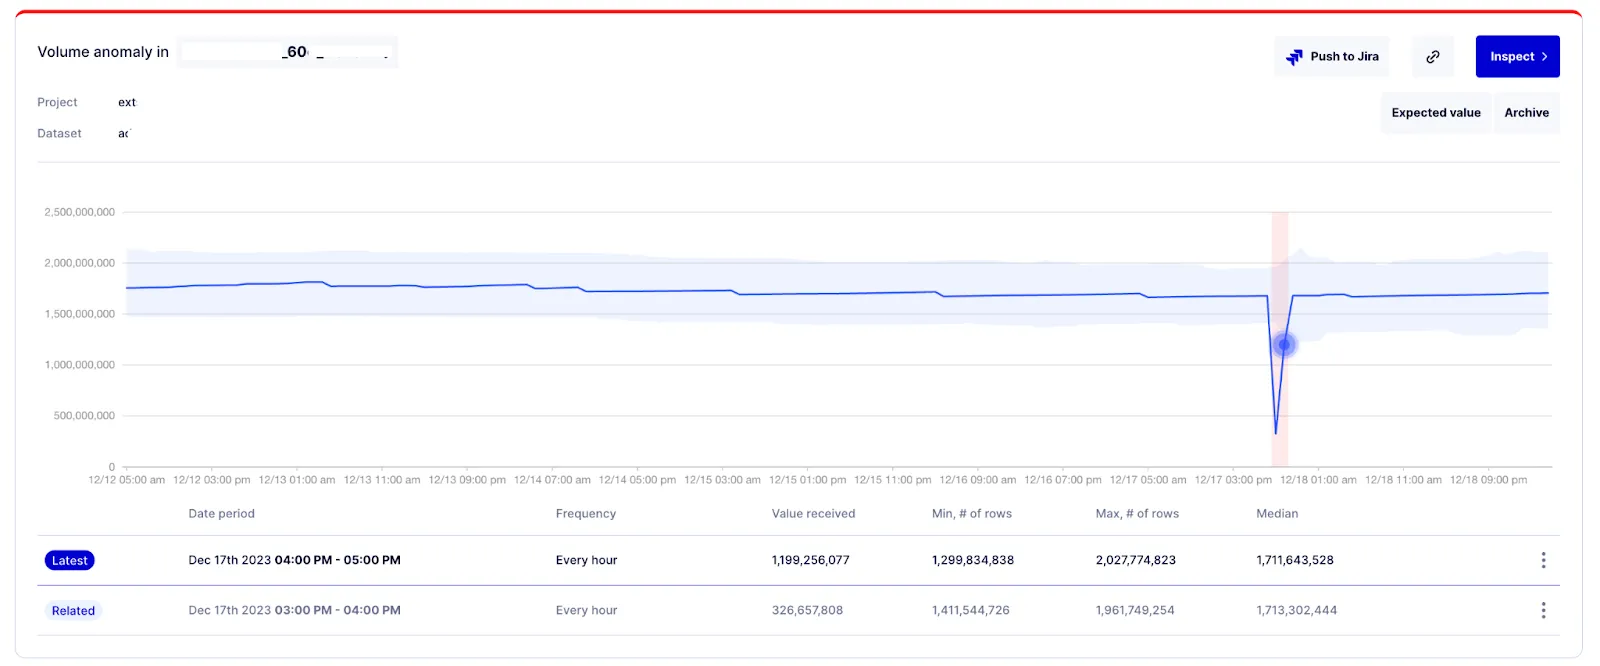
In the preceding example, you can see a table consistently adding rows and a sudden drop below the expected range during two ingestions.
The Incident tab contains:
- The name of the table where the incident occurred.
- Location on the table: its project and dataset.
- A graph indicating when the table experienced unusual volume changes, marked in red. Each blue bar represents an update event for the table.
- Below each incident, there is a table displaying: Date period, Frequency, Value received, Min, Max, Median, and Deviation based on past patterns.
Data quality
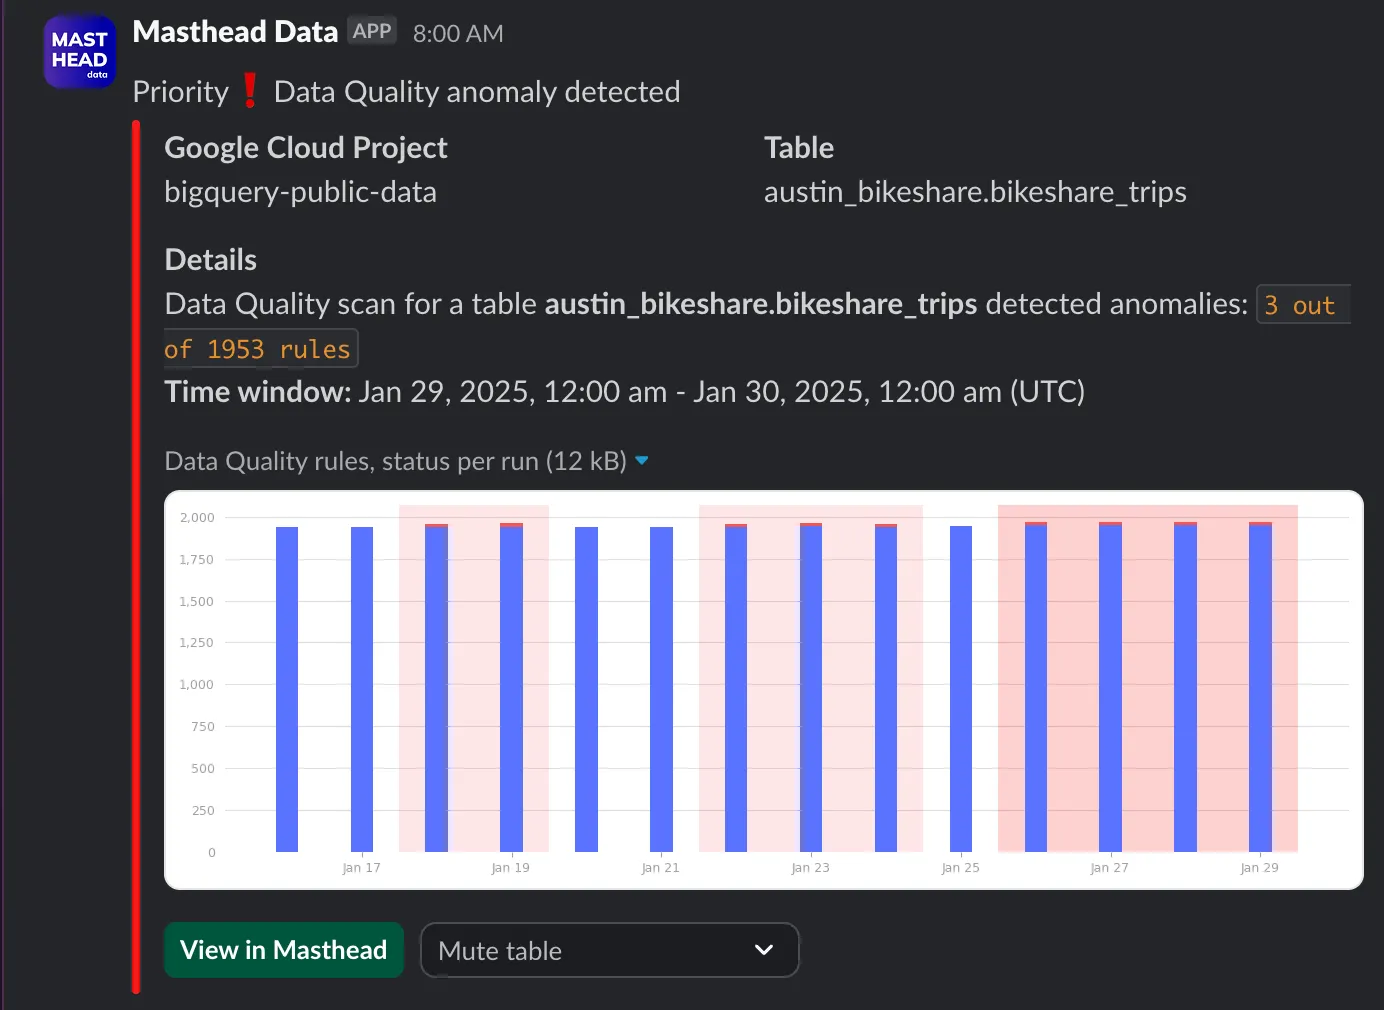
Section titled “Data quality”By leveraging custom data quality rules, you can implement specific validation queries tailored to your business needs. You store the results of these checks in dedicated tables within your project, providing a clear record of data quality status over time. See integration steps required in Data Quality.
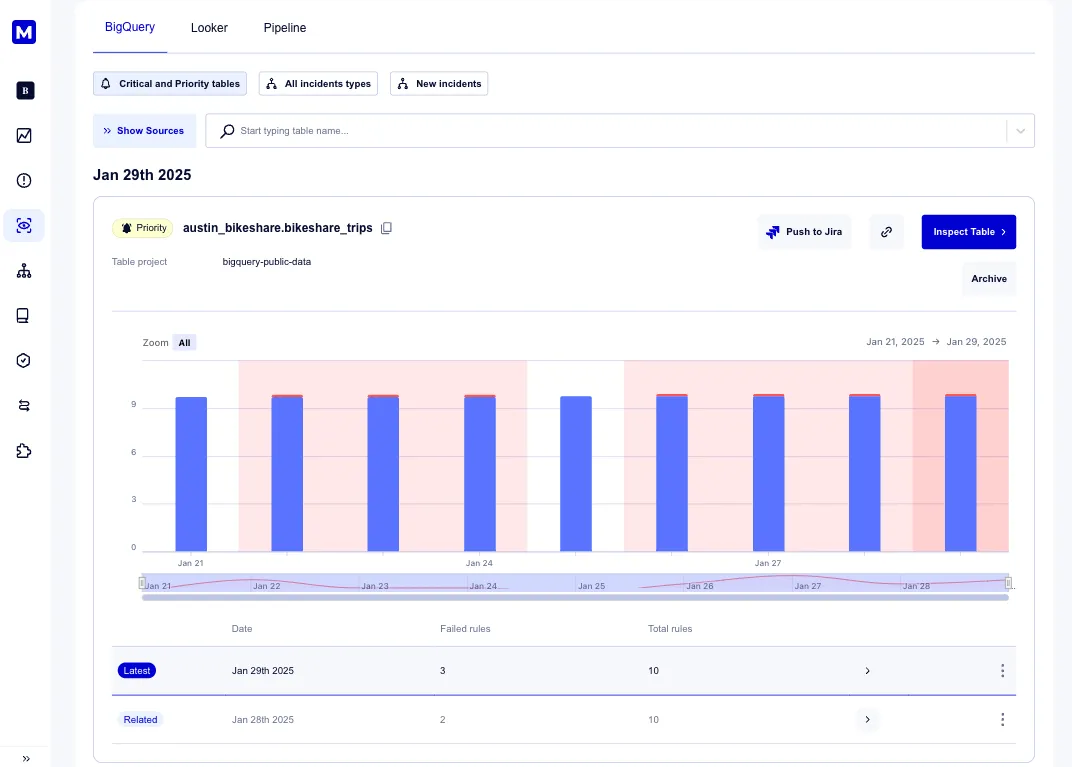
Masthead analyzes the scan results, identifies thresholds and triggers for the incidents, and sends notifications via your notification service integration.
-
what’s the look-back period during onboarding? Masthead uses 4 weeks of retrospective logs available in the audit log.
-
Do you access the schema table? No, to collect the necessary data points, Masthead uses only logs.
-
Which tables can Masthead monitor in the data warehouse using anomaly detection? Masthead automatically monitors all tables that updated within the cadences in the past month prior to Masthead’s deployment.
-
What data do you query? None. Masthead doesn’t request permissions nor read or edit clients’ data.
-
How long does it take to deliver the first insights and catch the first anomalies? Up to 6 hours, depending on the number of tables in BigQuery. During the deployment, Masthead parses retrospective logs, which allows an understanding of the patterns for every time-series table within BigQuery.
-
What metrics does data anomaly detection include?
- Freshness: the recency of a table update. Masthead automatically identifies the frequency of each table update by using GCP logs.
- Volume: volume of data received per insert and per aggregate step.
- Data Quality scans: custom data property changes. Masthead uses the data of the regularly scheduled data scans to analyze the anomalies.
-
Do you need to enable it manually? No. For Freshness and Volume Masthead parses retrospective logs and detects time-series automatically. Only Data Quality anomaly detection requires the configuration of custom data scans.